

GTO
Global Tactical Opportunities
Documents
Before investing, read the prospectus and the Key Information Document for the relevant share class. Both are available on this page.
Geopolitics help us to characterize the investment environment and our vision:
- Dysfunctionalities are worsened by interventions, volatility, correlation breakdowns.
- Coherent idea generation presents the initial state of the investment process.
- Investment and risk management are intrinsic elements.


Why is Geopolitics so important for us?
- Gotfried Wlihem Leibniz was the first to use this term in 1679. But Geopolitics was commonly used only at the end of the 19th century. This science became important in Germany, then in Great Britain and the USA.
- Geopolitics was no longer taught in University after WWII, wrongly accused of having fed the extremist ideology.
- The Cold War revived the necessity for governments and citizens to have a better vision of the world. Since the 80s, the expansion of this field has demonstrated its usefulness over the years.
- Oil price, Central Bank policies, migration, currency volatility, and correlation/decorrelation between asset classes are often generated by geopolitics.
- Implications of the trade war initiated by Trump’s administration are easily explained via geopolitics, highlighting risks regarding Hong Kong and Taiwan.
Investment Process
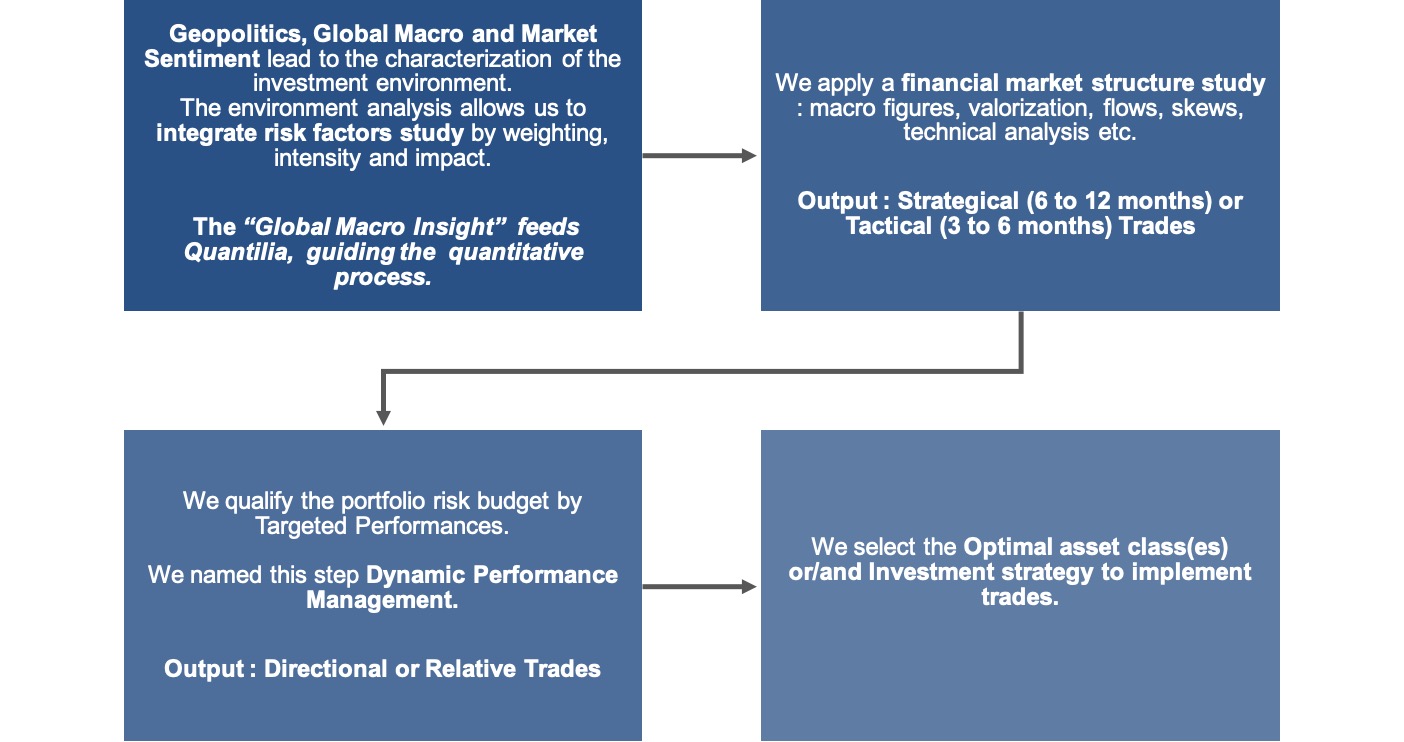
Navigating through the geopolitical and macro landscapes to capture the rise of macro thematic, our process identifies key moments in the future to determine if we can implement strategical or tactical trades. Therefore, analyzing the risk/reward, we select a directional or a relative strategy.
More about this image
A process diagram in four stages. The first reads the geopolitical and macro landscape. The second identifies key moments in the future at which a position could be established. The third assesses risk against reward. The fourth selects the expression: a directional position, or a relative-value one.
Risk management spans all four stages rather than following them, which is the diagram's point: it is intrinsic, not a final check.
Risk dashboard 2.0
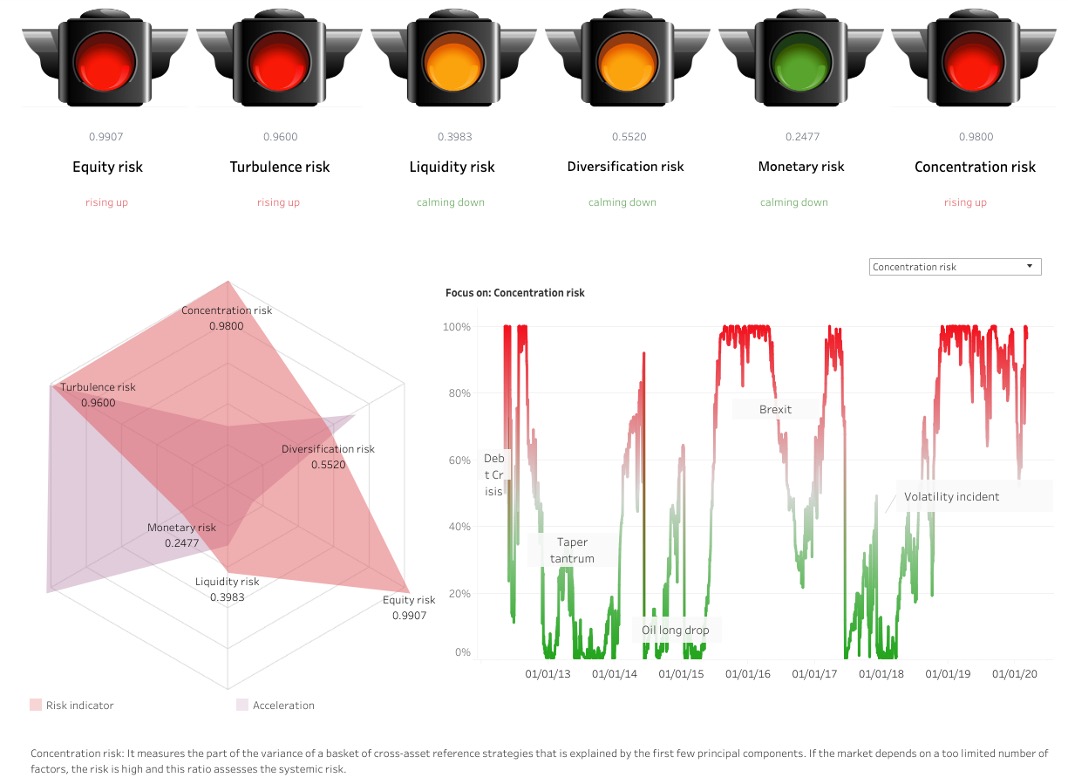
In addition to our fundamental approach, we integrate the quantitative process to read across criteria and to track extreme correlation and decorrelation. Quantilia generates dashboards and studies supporting us in all risk metrics.
More about this image
A risk dashboard laid out as a grid of asset classes against risk metrics: equities, bonds, commodities, currencies, real estate and volatility, read against monetary conditions, volatility regime, market sentiment, positioning and correlation state.
Extreme correlation and decorrelation are the two states the dashboard exists to surface, because both break the assumptions a diversified allocation rests on.